Global fire activity: weekly data and a continuous-domain reconstruction
Left of the line: the weekly number of satellite fire detections, counted on the 2° grid the model was fitted to. Right of the line: the reconstruction, a function of continuous position on the sphere and of the time of year. Drag the line to compare the two; drag the slider to move through the 1,200 weeks from 2003 to 2025. Click anywhere on the map to see the fire season of that 2° cell below.
For rough spatio-temporal data, ℓ1 regularization is a viable alternative to Gaussian processes: sparse, sharp, and open to any kind of measurement.
The content of the poster, section by section; click a title to open or close it.
1. Fire detections as measurements of a seasonal field
Many quantities on Earth repeat every year: fires, CO2, temperature, epidemics. The unknown is a field f(s, t), with s on the sphere 𝕊2 and t on the yearly circle 𝕋, which we only see through M linear measurements
where εm is noise and the sensor νm is a bounded measure: a point sample, the average over a cell, the total over a time window. Goal: recover f as a continuous function of space and time, from any kind of measurement.
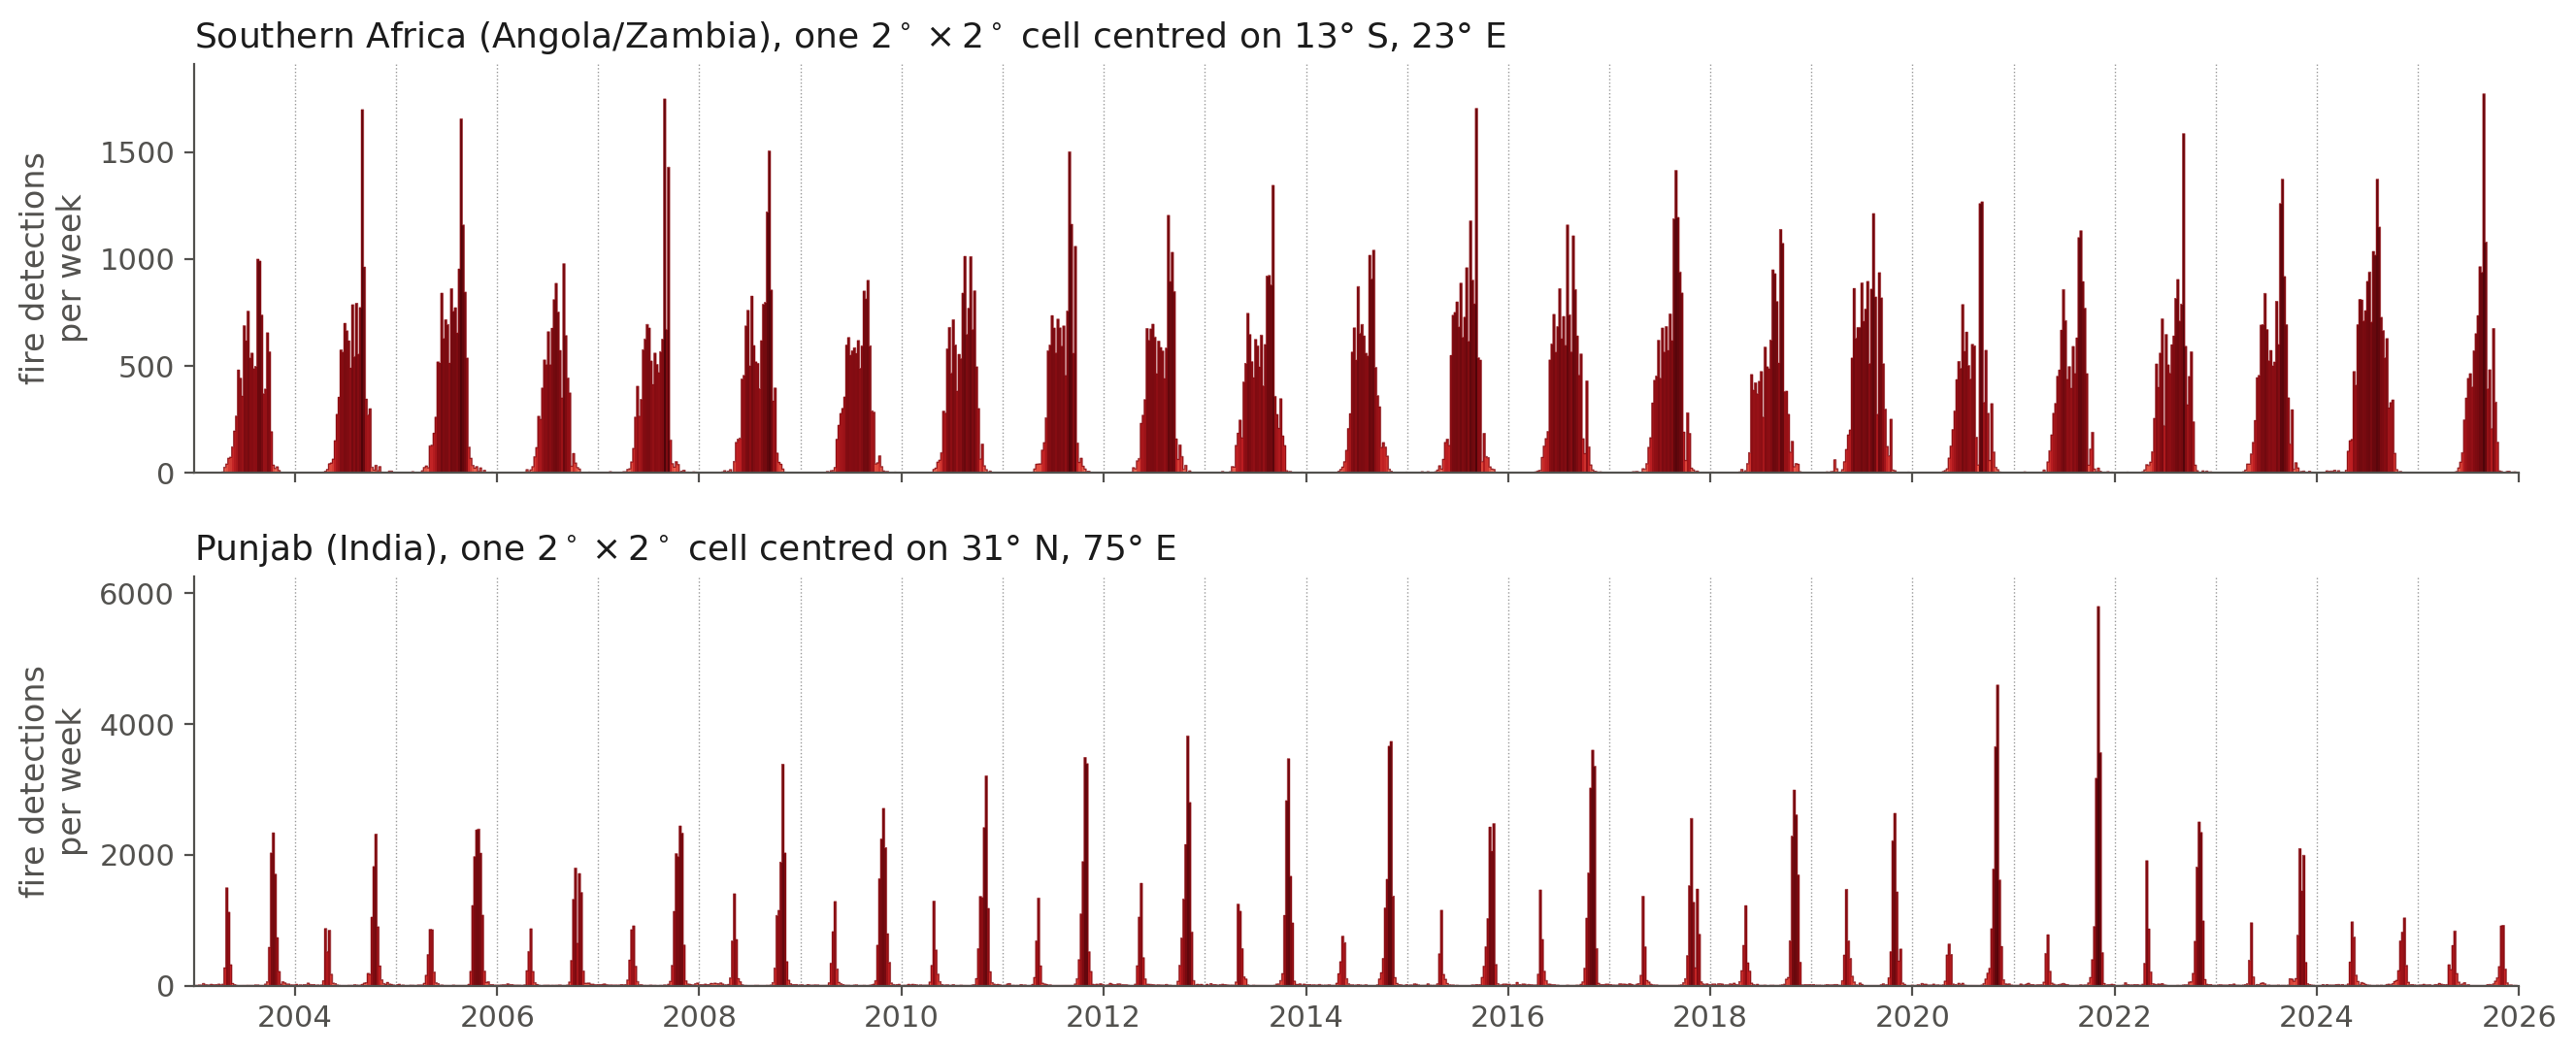
The fire data. NASA FIRMS active-fire detections (MODIS, 2003–2025), counted per week on 2° cells: 23 years × 52 weeks × 6005 land cells.
Fire formulation. Detections form a Poisson point process on 𝕊2 × 𝕋 of unknown intensity f ≥ 0 (detections per unit area and time), so the count of the land cell Cm in the week Wm′ is a local integral of f:
The sensor is separable: a cell on the sphere times a week on the circle. Since f is one-year periodic, the 23 years of the same week share the same intensity. With the Poisson loss E(y, z) = z − y ln z, the data term of the problem below is the negative log-likelihood of the counts and its solution is the maximum a posteriori estimate of f.
2. Why not a Gaussian process? The limits of the L2 approach
The classical answer is a Gaussian process (kriging): its posterior mean is also the minimiser of a quadratic, L2-type penalty. With a separable covariance gs(⟨s, ·⟩) gt(t − ·), the GP posterior mean is
One atom ψm per measurement, and an M × M system to solve.
- Ideal sampling, νm = δ at (s̄m, t̄m): the classical kriging formula, a shifted covariance,
- General measurements (cell and window averages): no closed form, every atom is a double integral of the covariance against its sensor, to be computed numerically for each of the M measurements before the system can even be formed.
Whatever the sensors, the GP solution is a sum of M atoms that are all as smooth as the covariance: nothing in it is sparse, and sharp seasonal features are smoothed out. Lessons from compressed sensing: use the ℓ1 norm to promote solutions that are sparse in a given dictionary.
3. The continuous-domain model: an optimization problem
The field splits into a seasonal cycle (zero mean over the year) and a yearly mean, f = fcycle + fmean(s). We solve
- ∂tn measures changes along the year (n = 4 in the fire fits); Ls measures roughness on the sphere.
- The 𝓜-norm (the total variation of a measure) is the measure-theoretic extension of the ℓ1 penalty: it asks for few seasonal changes and a simple yearly mean rather than for small ones everywhere.
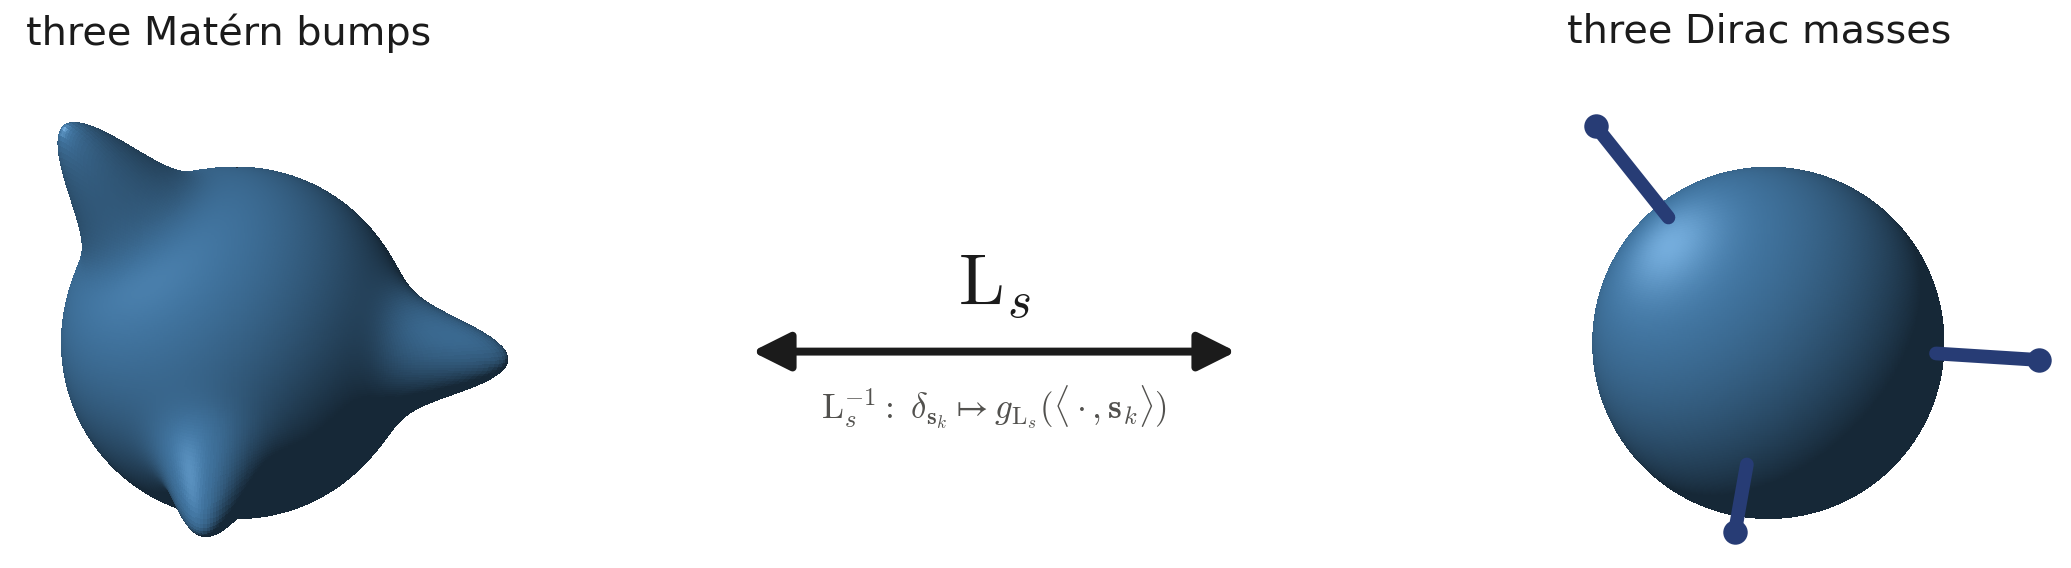
4. The shape of the solutions: a representer theorem
Theorem (representer). The extremal solutions of the problem of section 3 are spatio-temporal splines:
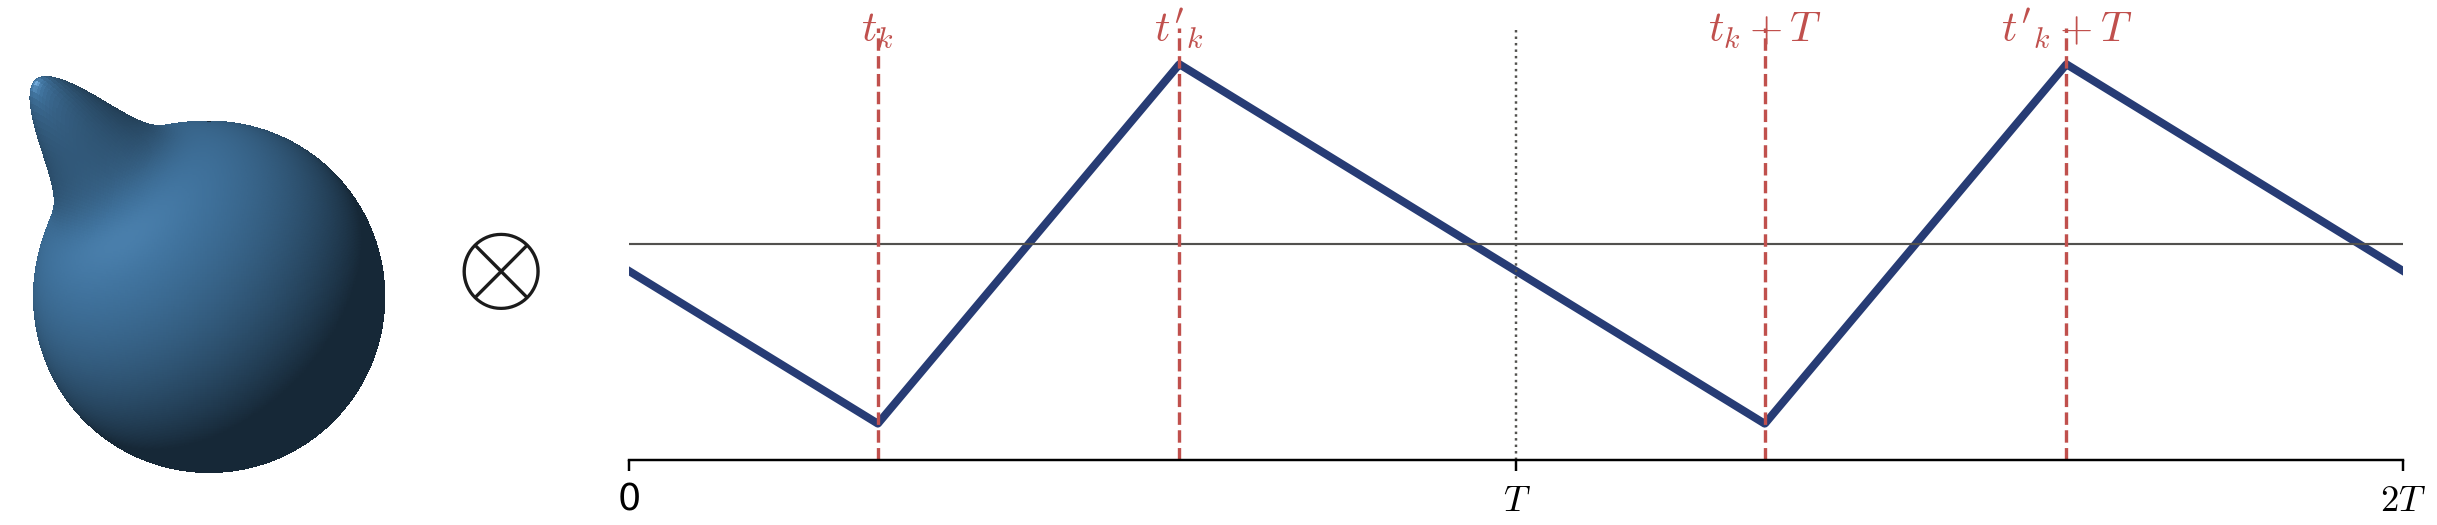
with fewer unknowns than data: K1 + K0 ≤ M. Here gLs is the Green's function of Ls and gn that of ∂tn on the circle, so that gn(· − tk) − gn(· − t′k) is a change of the seasonal level that starts at tk and is undone at t′k.
- Atoms are products of shifted Green's functions: a bump on the sphere times a change along the year.
- Holds for any linear measurement (averages, point samples).
5. Discretization and the computed solution
Discretization. Restrict the parameters of the representer formula to a grid:
where A is the coefficient matrix (one row per bump, one column per knot of the year), gLs(⟨·, sk⟩) the bump centred at sk, and βn,h the periodic B-spline of degree n − 1 with knot spacing h. Setup: for separable measurements νs,m ⊗ νt,m′ the problem of section 3 is exactly
where
- : the bump k seen by the spatial sensor m (the integral of the bump over the cell Cm);
- : the B-spline k′ seen by the time sensor m′ (its integral over the week Wm′);
- : the n-th periodic finite differences, so that lists the seasonal changes of every bump;
- : the yearly mean of each bump's coefficients.
Solve with a primal-dual splitting (here ADMM). Fast because S and T are small and sparse: a bump overlaps a handful of cells, a B-spline a handful of weeks.
The fire fits.
- Space: KΞ ≈ 39,000 Matérn bumps gLs (smoothness 5/2, scale 0.52°, width at half maximum 1.1°) centred on a Fibonacci lattice where they reach land. Time: KT = 52 cubic periodic B-splines, one per week (n = 4, h = one week).
- Coefficients A ≥ 0: the intensity is nonnegative.
- λ0 = 10−3 λ; λ = 6.8·10−3, chosen on 10 % held-out data at a coarser scale (0.63° bumps) and rescaled by the ratio of the bumps' masses.
What the map shows: an approximate solution. Because the atoms sit on a fixed grid instead of free positions, and the iterations run to a finite accuracy, fA is an approximation of the solution of the continuous-domain problem. It is the function drawn to the right of the line, evaluated at every pixel and averaged over the selected week.


Click elsewhere on the map to change the cell; click in the lower chart to move the map to that week.
- data: mean weekly count over 2003–2025
- 𝓜 intensity fA
- 𝓜 fitted measurement
- selected week
- weekly detections, 2003–2025
- 𝓜 intensity, the same every year
6. Results on the poster: 𝓜-norm against L2
The poster fits the same problem twice, with the 𝓜-norm penalty shown on the map and with its quadratic (L2) counterpart, at the same budget.
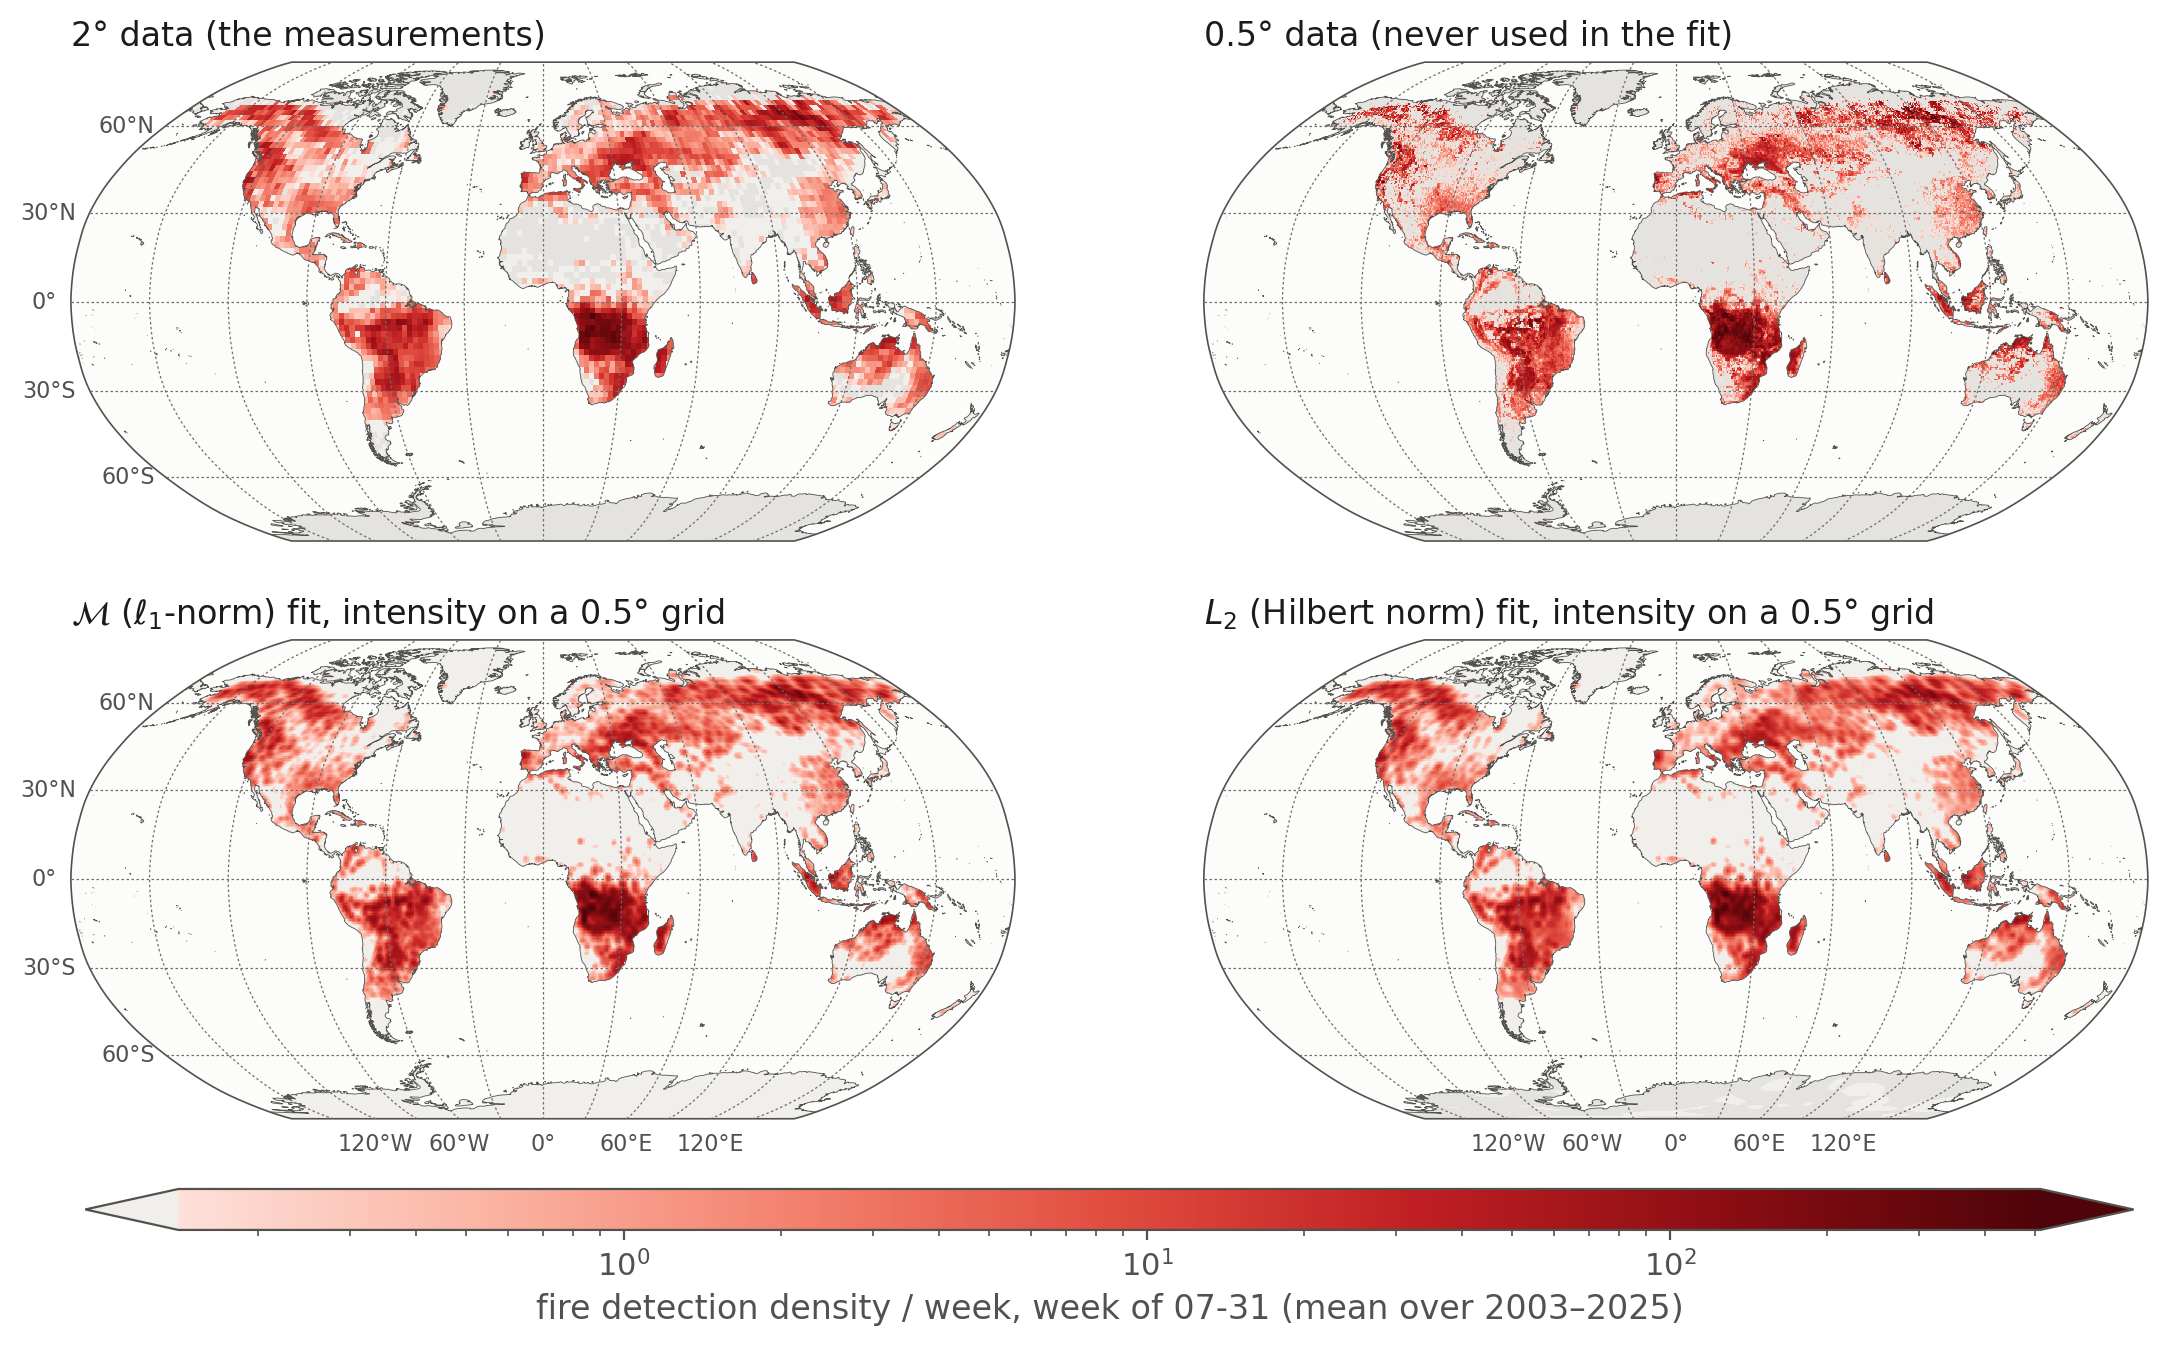
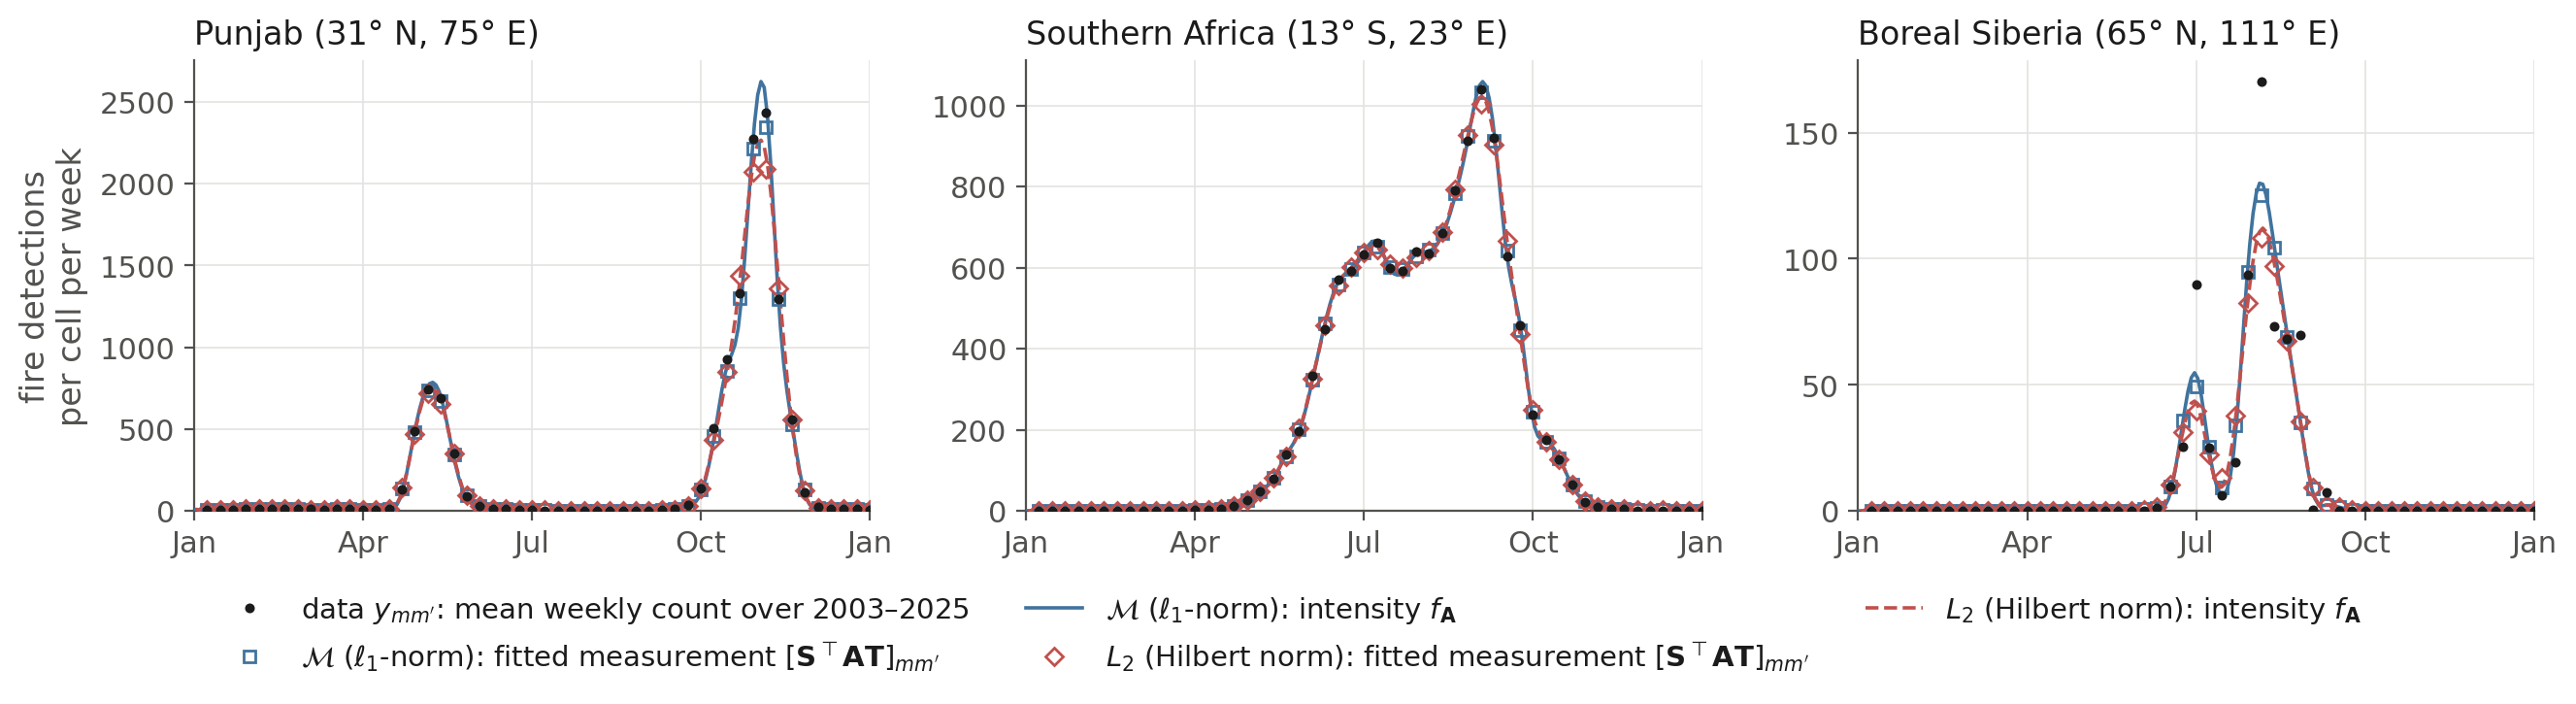
- The 𝓜-norm describes a bump's year with 13 changes out of 52 weeks; L2 needs 36.
- Both penalties predict unseen weeks equally well.
- The 𝓜-norm keeps the short, intense seasons sharper.
- Extends to a seasonal–trend decomposition.
References. V. Guillemet, J. Fageot, M. Unser, Spatio-temporal trend-seasonal decomposition: from ideal sampling to general measurements, preprint 2026 · M. Unser, J. Fageot, J. P. Ward, Splines are universal solutions of linear inverse problems with generalized TV regularization, SIAM Review 2017 · M. Simeoni, Functional penalised basis pursuit on spheres, ACHA 2021.
Data: NASA FIRMS, MODIS Collection 6.1 active-fire detections, counted per week on 2° land cells (2003–2025). Model: the 𝓜-norm (ℓ1) penalised fit on the sphere × a periodic year, built from about 39,000 Matérn bumps and periodic cubic splines; on the map it is evaluated at every pixel and averaged over the selected week. It is the same every year: it describes the typical fire season. Colours as on the poster Sparse Spatio-Temporal Models on the Sphere for Seasonal Data Analysis (V. Guillemet, J. Fageot, M. Unser; SIAM Conference on Imaging Science 2026).